
What did SFMTA’s most recent feedback survey about Lake Street say?
In March 2022, SFMTA released their long-awaited results and analysis of their feedback survey from Dec '21-Jan '22. The data tells a clear story:
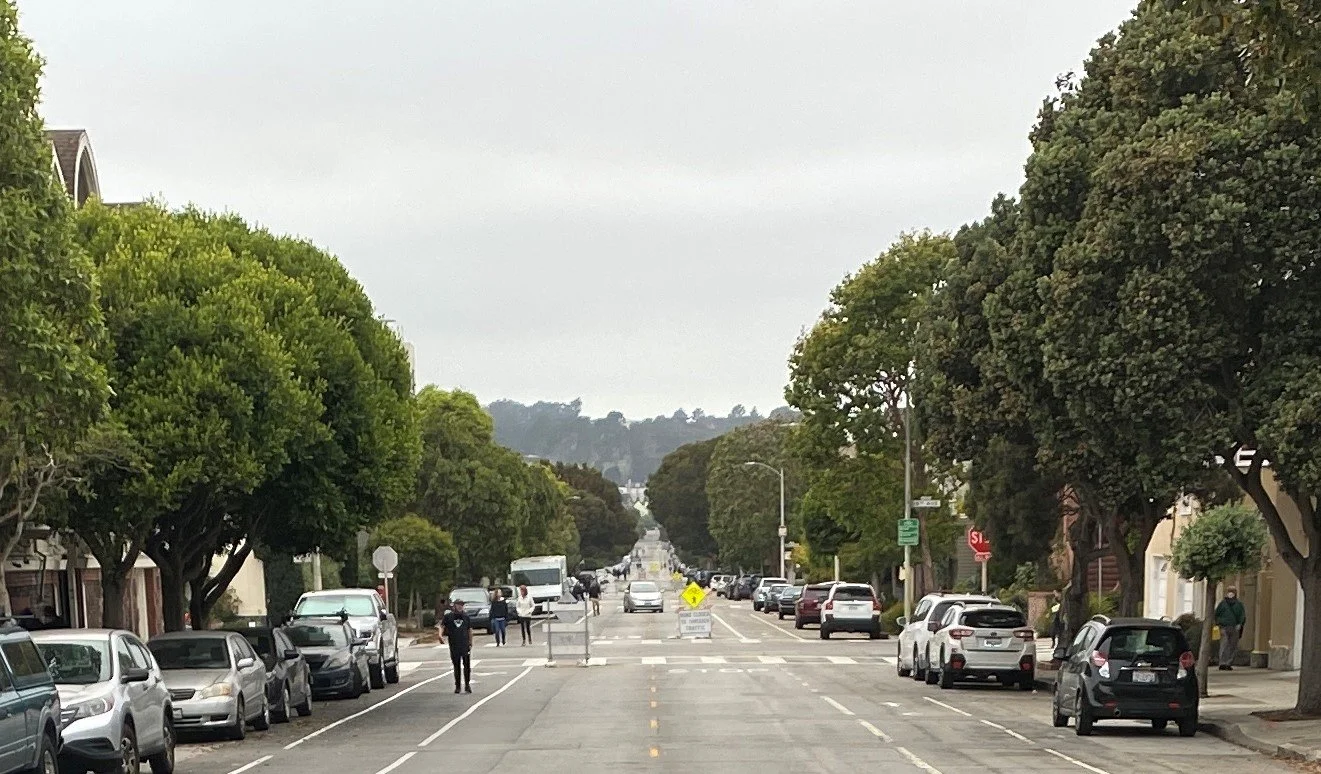
There simply isn't strong or overwhelming support for Slow Lake Street in the neighborhood.
Nearly 6,000 SF residents took this survey (4,000 from the Richmond District)
Richmond District respondents were essentially split down the middle 47-53 (47% for reopening, 53% for a Slow Street)
Disapproval ratings were higher than approval ratings for each of the 3 Slow Street design options proposed by SFMTA:
Slow Street Option 1: 58% disapproved, only 31% approved
Slow Street Option 2: 50% disapproved, only 42% approved
Slow Street Option 3: 51% disapproved, only 40% approved
When asked to rank the proposed options, Richmond District residents chose reopening as their #1 rank choice 25% more often than any of the Slow Street options.
SFMTA published a hastily performed traffic study that attempted to conclude that traffic on neighboring California Street has not increased significantly since Slow Lake Street. It's a nice try, but we believe the eyes, ears and experiences of the 1,840 neighbors of OpenLakeStreet.org who say otherwise.
So how are Slow Lake Street supporters and SFMTA trying to spin these survey results?
Unsurprisingly, they point singularly to high (83.5%) Slow Street support among a mere 361 Slow Lake supporters who live directly on Lake St. However, the strong desire for a private street among this small group of respondents (only 6% of total survey respondents) quickly melts away when the thousands of voices of those who live adjacent to Lake are added into the mix.
There simply isn't strong or overwhelming support for Slow Lake Street in the neighborhood.